Determination of a complex electric distribution network topology and its applications
There are increasing benefits to be gained from determining low-voltage electric distribution network connectivity or topology. The term ‘network connectivity or topology’ refers to the process of determining an end-consumer connection with respect to an LV network transformer, that is, to which transformer, feeder, and phase(s) that customer is connected. This network, in turn, may or may not have intermediate distribution elements. In addition, it is also important to know their connections in order to have a complete map of the consumers linked to a transformer and to the LV network in general.

Image 1. LV distribution network with intermediate distribution elements (cascade arragement).
The determination of the network topology, prior to the ‘era of the digitisation of the electric distribution network – Smart Metering’, already provided many benefits. It has facilitated estimating the load balancing of a transformer and its feeders, therefore distributing customers in a balanced way, as well as carrying out maintenance operations on a feeder knowing which customers were going to have a power cut or limiting which customers may be altering the wave quality detected in a feeder. That said, in the current situation of digitisation of the electric distribution network, or during its digitisation process (with the installation of smart meters and/or measuring devices in the Low Voltage panel of a TS) these advantages are taken to a much higher level.
For example, Smart Meters can take remote and continuous readings of the customer’s consumption. If this information is cross-checked with the user’s connection data and that of the transformer (known as the electric distribution network connectivity or topology), it is possible to know exactly what the load balances and imbalances are between its various phases and feeders, which enables adjusting the network, as well as planning new connections for future consumers.
If, in addition, the measurement and the management system include electronics for measuring voltages and currents on the LV panel feeders, any issues with the network’s power quality can be quickly identified and their origin pinpointed, technical losses in the feeders can be measured and, above all, non-technical losses or theft can be detected.
Changes in the topology and the need to update databases
The electric distribution network topology undergoes variations and changes over time due to network breakdowns, maintenance tasks and changes in distribution… Therefore, today it is essential to have a totally reliable database with connection data of 100% of customers, in order to be able to apply all the above-mentioned benefits effectively. Otherwise, the calculation of feeder balances, losses and other parameters cannot be carried out, and the network would become uncontrollable no matter how ‘smart’ it was.
More and more electricity distribution companies are deciding to take advantage of large Smart Meter installation campaigns, identifying the consumer connection with the help of ‘phase and feeder identification portable devices’ in just a few seconds per consumer. Time investment is very low, and profitability is very high.
These devices have a Central Device that is installed in a distribution station (covering each one of the feeders) and a Line Device that is connected to the consumer with whom the connection to that transformer station is desired.
The determination of topology becomes yet more crucial particularly in countries with complex low-voltage distribution systems that have intermediate cascading elements such as feeder pillars or boxes (apart from the low-voltage panel itself in the TS).
Until now, portable topology devices have not been able to work efficiently in complex networks, since no more than one device could be installed per transformer station due to its modus operandi. Therefore, the topology of all customers to a distribution element had to be determined and the operation repeated in as many TS as there were.
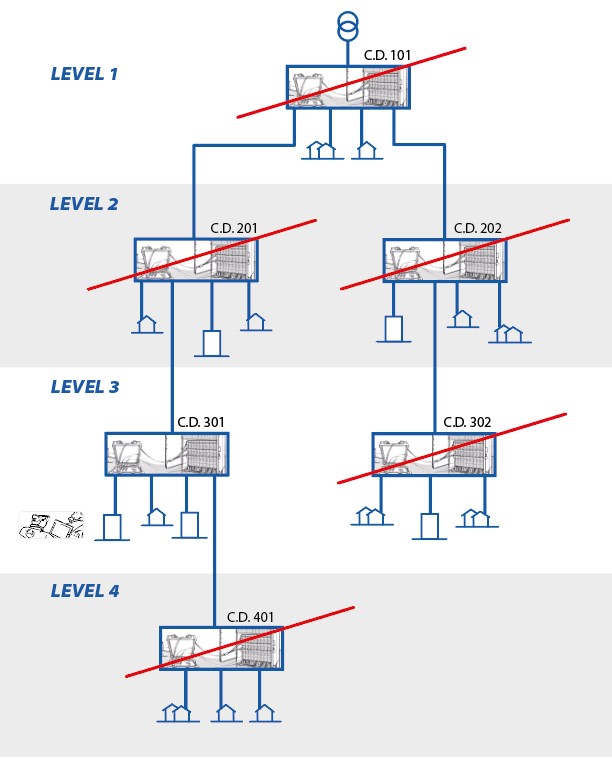
Image 2. Installation of the Central Device in a single secondary substation (cascade arrangement).
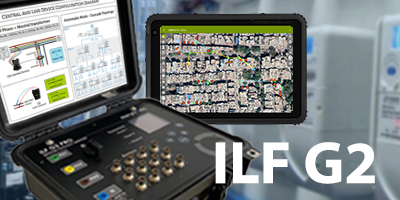
To this effect, Merytronic has designed and manufactured a second generation of electric distribution network topology ‘ILF G2 Pro’ device capable of operating simultaneously on several distribution levels linked to a transformer.
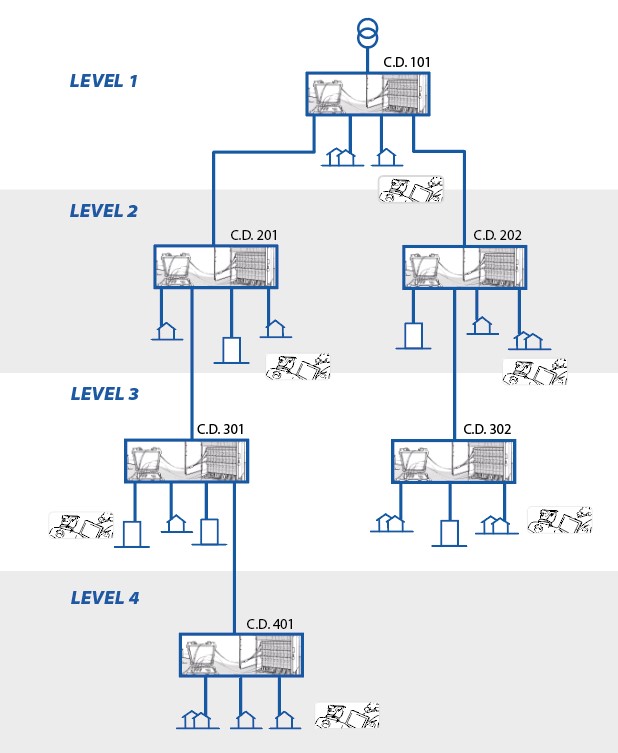
Image 3. Installation of the connectivity devices in each of the distribution elements (cascade arrangement). They are connected simultaneously.
Solutions for obtaining efficient topology
Next, a simple time estimation exercise shall be performed to obtain a complex network topology with several intermediate cascading elements, firstly with a first generation ‘ILF12’ or similar connectivity device (without cascade mode), and then compared with a first generation ‘ILF G2 Pro’ device, which can be operated in cascade mode.
Imagine a system in which for each TS there are about 6 distribution elements, distributed on 4 cascade levels, and with an average of 250 consumers per TS.
With a first-generation device, it will only be possible to determine customer connections with respect to the element where the central device has been placed (see image 2). As previously mentioned, the operation has to be repeated in order to find out the customer’s connection with respect to the rest of the distribution elements that are on other levels. There may be elements that have to be automatically discarded due to the diagrams or references established, but it will probably be necessary to visit each customer two or three times in order to make sure their topology has been determined correctly.
On the other hand, with ILF G2 model (Image 3), 6 central units in the 6 TS could be simultaneously connected and the customers, with up to 6 operators (each one with a Line Device) could be checked. In this case, by identifying each consumer, the entire network diagram to which that customer is linked is automatically obtained.
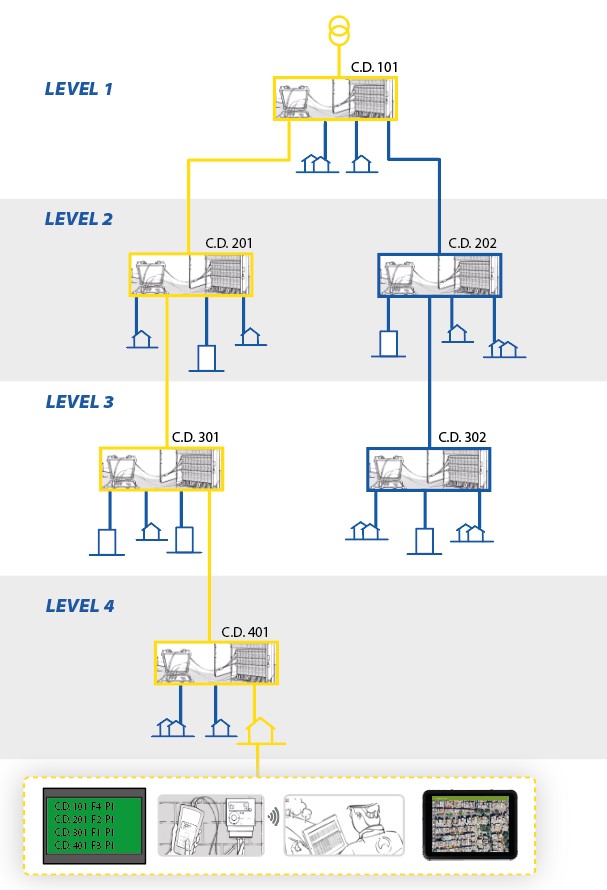
Image 4. By identifying them, it is possible to obtain the topology’s result with respect to all the TS upstream from the consumer.
Considering that about 250 consumers are linked up to each TS, and that there are 6 operators for all the TS, each of them has to identify around 41-42 consumers. Based on real figures, it can be concluded that an operator can analyse (depending on many factors) an average of 40-45 customers in a working day. Therefore, with this pack of 6 devices and 6 operators, 250 customer connections could be determined every day, which corresponds to 1 full TS. In this process, no Central Device located in the different distributor elements has had to be moved or reinstalled throughout the day.
If, on the other hand, a Generation 1 device were to be used (without a cascade functionality). The distribution topology element per distribution element would have to be determined by moving the Central Device in each operation, which implies going to each consumer on two, three or four occasions in order to determine the topology of a single TS. This requires not only several identifications having to be made, but the Central Devices also being moved several times a day in order to repeat the operation. Thus, the time invested can be multiplied two, three or four-fold, depending on the network diagram. Even the likelihood of a mistake being made when obtaining results is greatly increased.
Data digitalisation
The process of determining the network topology, especially in large campaigns, requires thousands of data being recorded in the field. It would be practically impossible to easily record them by hand without any mistakes being made, therefore it is essential to be able to digitise the data automatically in the field in order to export it to the database afterwards. For this purpose, Merytronic offers the ‘Grid GIS Connect App’, developed by Ariadna Grid, which enables easily and automatically opening, editing and saving all the information regarding customers’ connectivity on a map with their corresponding coordinates.
Its operation is very simple: every time the topology device identifies a customer, it sends all the information about its topology (with respect to all the TS) to the Tablet via Bluetooth. This App saves a lot of time in the data capture process and avoids many transcription errors.
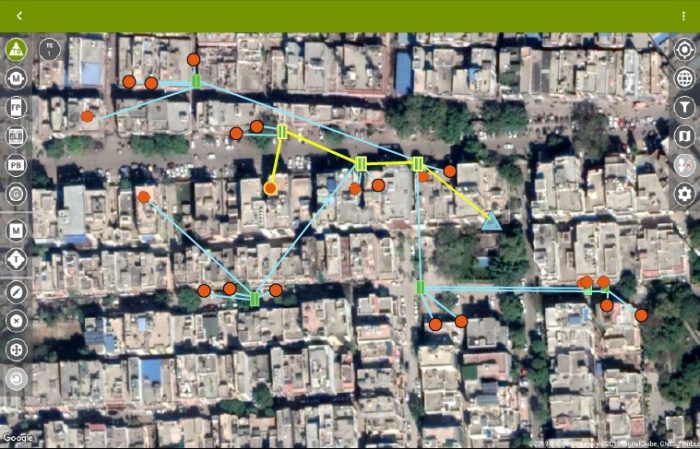
Image 5. Map showing the electric distribution network topology in a neighbourhood.
Furthermore, all the recorded data can be sent and integrated in the company´s database. The tandem Merytronic-Ariadna makes possible any development or customization in order to process (import and export) the important data from the tablet to the database automatically, in a format “readable” by both Systems.
Conclusion
The importance of having a database with Low Voltage electric distribution network topology updated has been demonstrated. The range of functionalities and advantages that arise from knowing the network topology makes it priceless.
A simple, robust, and efficient way to determine the topology by exploiting large Smart Meter installation campaigns using Merytronic’s different solutions has also been set forth. Not only can information be obtained in a simple and automatic way by saving it on a map in a tablet, it is also possible to integrate GIS systems and databases so that all this process requires the least human interaction possible, thus reducing time and costs, as well as avoiding errors when recording and saving the results.

Related News
Topology of meters in distribution networks
The increase in the number of subscribers and the growth of increasingly complex distribution networks...
A new model of resilient LV network for massive EV charging and Distributed Generation
Paper presented at CIRED 2022 Porto Worshop. Introduction The increasing use of Electric Vehicles (EVs)...
Automation solutions for Smart LV distribution networks
The increase in Electric Vehicle charging sessions is one of the main challenges facing DSOs,...


